Hydrogen-Bond-Basicity Prediction
Python API · stjames models · API example
How it works
Rowan predicts hydrogen-bond-acceptor strength, pKBHX, and hydrogen-bond-donor strength, pKα, at individual sites in a molecule. Higher values indicate stronger acceptors or donors on their respective scales. These quantities describe hydrogen-bond association rather than the proton-transfer acidity measured by pKa. Use them to compare sites or assess how structural changes affect hydrogen bonding.
Settings
- Run conformer search? Enabled by default. Generate conformers with OpenConf, optimize them with AIMNet2, and use the lowest-energy retained conformer.
- Optimize structure(s)? Enabled by default and required when conformer search is enabled. With search disabled, optimize the supplied structure with AIMNet2. With both settings disabled, evaluate the supplied geometry directly.
Notes
The web form accepts neutral, closed-shell molecules. Predictions use one geometry, so conformational changes and intramolecular hydrogen bonds can affect the results; the workflow does not average over a conformer ensemble.
A single r2SCAN-3c calculation provides the molecular electrostatic potential. Acceptor predictions use local potential minima near recognized functional groups, with group-specific calibration. Donor predictions use the potential at fixed points beyond C–H, N–H, O–H, and S–H bonds, calibrated to pKα.
The "Hydrogen-bond acceptors" and "Hydrogen-bond donors" tabs show site values in tables and on the molecular structure. An acceptor atom can have multiple sites. "Predicted Molecular pKBHX" combines acceptor-site contributions rather than reporting only the strongest site; the web interface includes only acceptor sites with pKBHX greater than −1.
The acceptor scale is calibrated to association with 4-fluorophenol in carbon tetrachloride; the donor scale uses N-methylpyrrolidone in 1,1,1-trichloroethane. These are reference scales, so solvent changes and steric shielding can alter actual hydrogen-bond interactions.
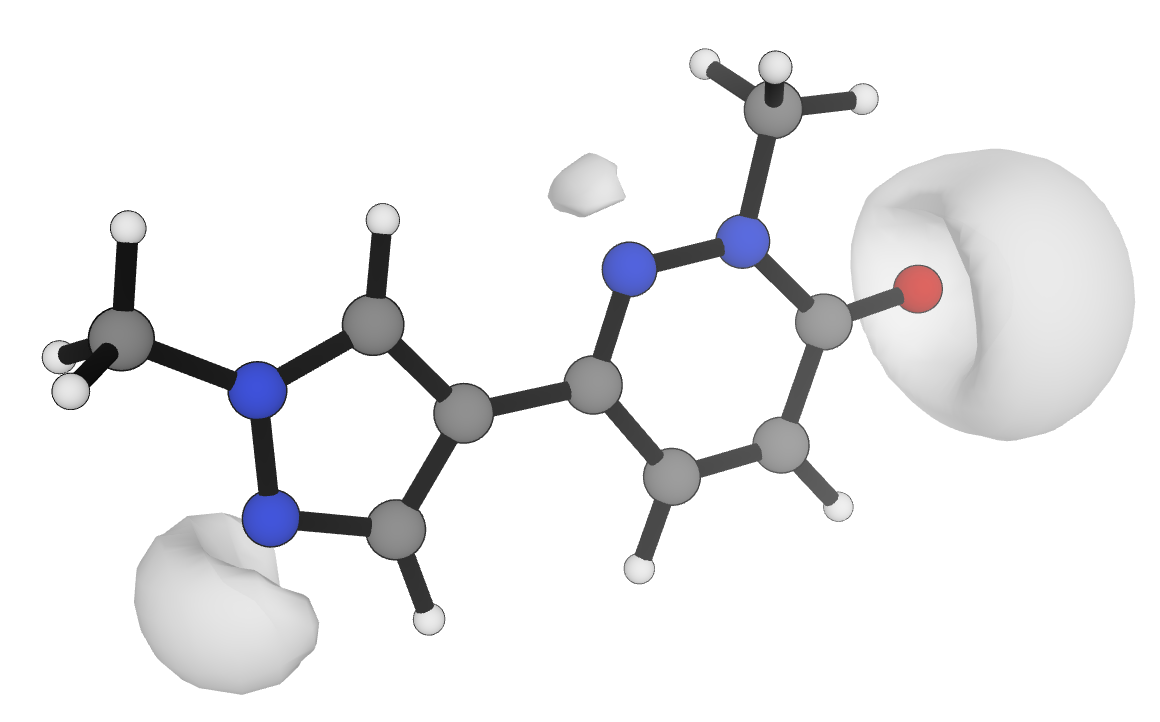
Visualization of the −0.04 electrostatic potential isosurface at the r2SCAN-3c level of theory for an example drug-like molecule.
Benchmarks and validation
The published acceptor calibration used 434 molecules with experimentally measured pKBHX values. Levenberg–Marquardt least-squares fitting combined contributions from distinct potential minima, up to three per acceptor. The table reports errors on this fitting dataset: mean absolute error (MAE) 0.188 and root mean squared error (RMSE) 0.270 pKBHX units. These are calibration errors, rather than an independent test of the current workflow. The published conformer-generation protocol predates the current OpenConf search.
| Functional group | Number | Slope () | Intercept | MAE | RMSE |
|---|---|---|---|---|---|
| Amine | 171 | −34.4386 | −1.4884 | 0.212 | 0.324 |
| Aromatic N | 71 | −52.8126 | −3.1376 | 0.113 | 0.150 |
| Imine | 28 | −48.4007 | −2.3309 | 0.180 | 0.236 |
| Nitrile | 28 | −50.1167 | −3.2273 | 0.144 | 0.198 |
| N-oxide | 16 | −74.3261 | −4.4159 | 0.455 | 0.589 |
| Chalcogen oxide | 17 | −47.7009 | −2.2794 | 0.186 | 0.224 |
| Pnictogen oxide | 16 | −61.1141 | −3.3839 | 0.437 | 0.549 |
| Carbonyl | 128 | −57.2911 | −3.5271 | 0.160 | 0.208 |
| Ether/hydroxyl | 99 | −35.9245 | −2.0338 | 0.188 | 0.239 |
| Thiocarbonyl | 10 | −51.8837 | −2.2649 | 0.330 | 0.384 |
| Divalent S | 17 | −39.1666 | −2.1243 | 0.086 | 0.127 |
| Aromatic O | 11 | −35.9245 | −2.0338 | 0.125 | 0.158 |
| Fluorine | 23 | −16.4441 | −1.2540 | 0.202 | 0.276 |
| Total | 434 | 0.188 | 0.270 |
Bulky amines were prominent outliers because steric shielding can prevent a donor from approaching an otherwise strong acceptor. For details, see the preprint.